(b) Use your results for (3) and (4) to find the equation of motion.
(c) Use your results for (1) and (2) to find the equation of motion and show that your result agrees with part (b).
Physics 321 -- Spring 2004
Homework #5,
due at beginning of class Wednesday Feb. 25
Read
Chapter 3, sections 3.1 – 3.6 and Appendix C.
1. [3pts]
The force on a particle of mass M is equal to c p2 where p is the
momentum and c is a constant.
(a) Find the velocity v as a function of time, given that v = v0 at time t = 0.
(b) Then find the position x as a function of time, given that x = x0 at time t = 0.
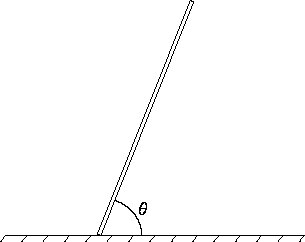
2. [4pts]
A stick of length b has mass per unit length
rho = rho0 (b2 - s2)/b2, where
rho0 is a constant and s is the distance measured along the stick starting at
the bottom end. The stick is falling to the floor. The end on the floor is not slipping.
(b) Use your results for (3) and (4) to find the equation of motion.
(c) Use your results for (1) and (2) to find the equation of motion and show that your result
agrees with part (b).
3. [3pts] Marion & Thornton: problem 3-1.
Give your answers in SI (=Standard International = kg,meter,sec) units, even though the
numerical values in this problem are specified in old-fashioned cgs units.
4. [3pts] Marion & Thornton, problem 3-2.
5. [3pts] Marion & Thornton, problem 3-3.
Again give your answers in SI units.
6. [3pts] Marion & Thornton, problem 3-9.
7. [4pts] Marion & Thornton, problem 3-23. Don't bother to plot the two
components e-bt and cos(w1t-d) -- just plot x(t). Also, instead of making nine separate plots,
make only three plots -- one for each value of delta
-- and put three graphs on each plot for the three different values of beta.
Don't bother with any plots of beta=0.
You can make the plots using Mathematica in one of the
computer labs on campus. To plot a
function in Mathematica, you use commands like:
f = Cos[3*x+4]
Plot[f, {x, 0, 10}]
To plot three functions, you can use:
Plot[{f,g,h}, {x, 0, 10}]
To override Mathematica's choice of the y-range shown, you may want to use
Plot[{f,g,h}, {x, 0, 10},PlotRange->All] or
Plot[{f,g,h}, {x, 0, 10},PlotRange->{-1,1}]