Modification II: Shift atom
Modification
Original structure
Shifting an atom
Expanding the lattice
Goto
Contents
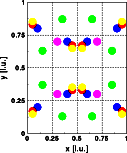
| Atom | Position x | Position y | Position z | Color in picture |
| Na | 0.10 | 0.20 | 0.30 | blue |
| K | 0.45 | 0.33 | 0.05 | red |
| Li | 0.15 | 0.63 | 0.65 | green |
| O | 0.30 | 0.30 | 0.30 | violet |
| O | 0.05 | 0.85 | 0.75 | yellow |
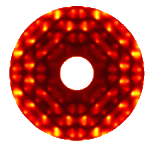
The left image shows the original Fourier transform of the unit cell, the right image the Fourier transform of the modified unit cell. The overall intensity distribution is similar, the intensity in the range h= 4 to 6 has changed considerably. Both pictures show the hk0 layer of reciprocal space. The image corresponds to the Fourier transform of a single unit cell. The intensity distributions of the crystal are shown as blue dots marking the Bragg reflections.
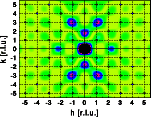
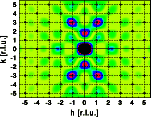
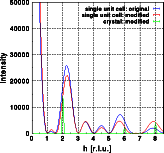
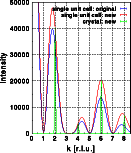
The identical one-dimensional cuts as in the previous example demonstrate the intensity change even more clearly. The blue curves give the intensity distribution of the original cell, the red curves those of the modified cell. The Fourier transform of the crystal based on the modified unit cell is displayed as a green line. Note that the relative intensity change varies considerably through reciprocal space. Again, the vertical scale has been cut off at approximately 40% of the intensity at 0,0,0. Click on the pictures to get a full screen image.
The students can learn the following based on the observations made so far:
- The intensity of the Bragg reflections is fully determined by the Fourier transform of the unit cell.
- The positions of the Bragg reflections remain invariant to changes of within the unit cell.
- The intensity of the Bragg reflections are changed if the atoms are moved to new sites within the unit cell. This sensitivity forms the basis for successful structure refinements.
