| Effects of Selection Bias on Cosmological Cluster Surveys |
|
|
|
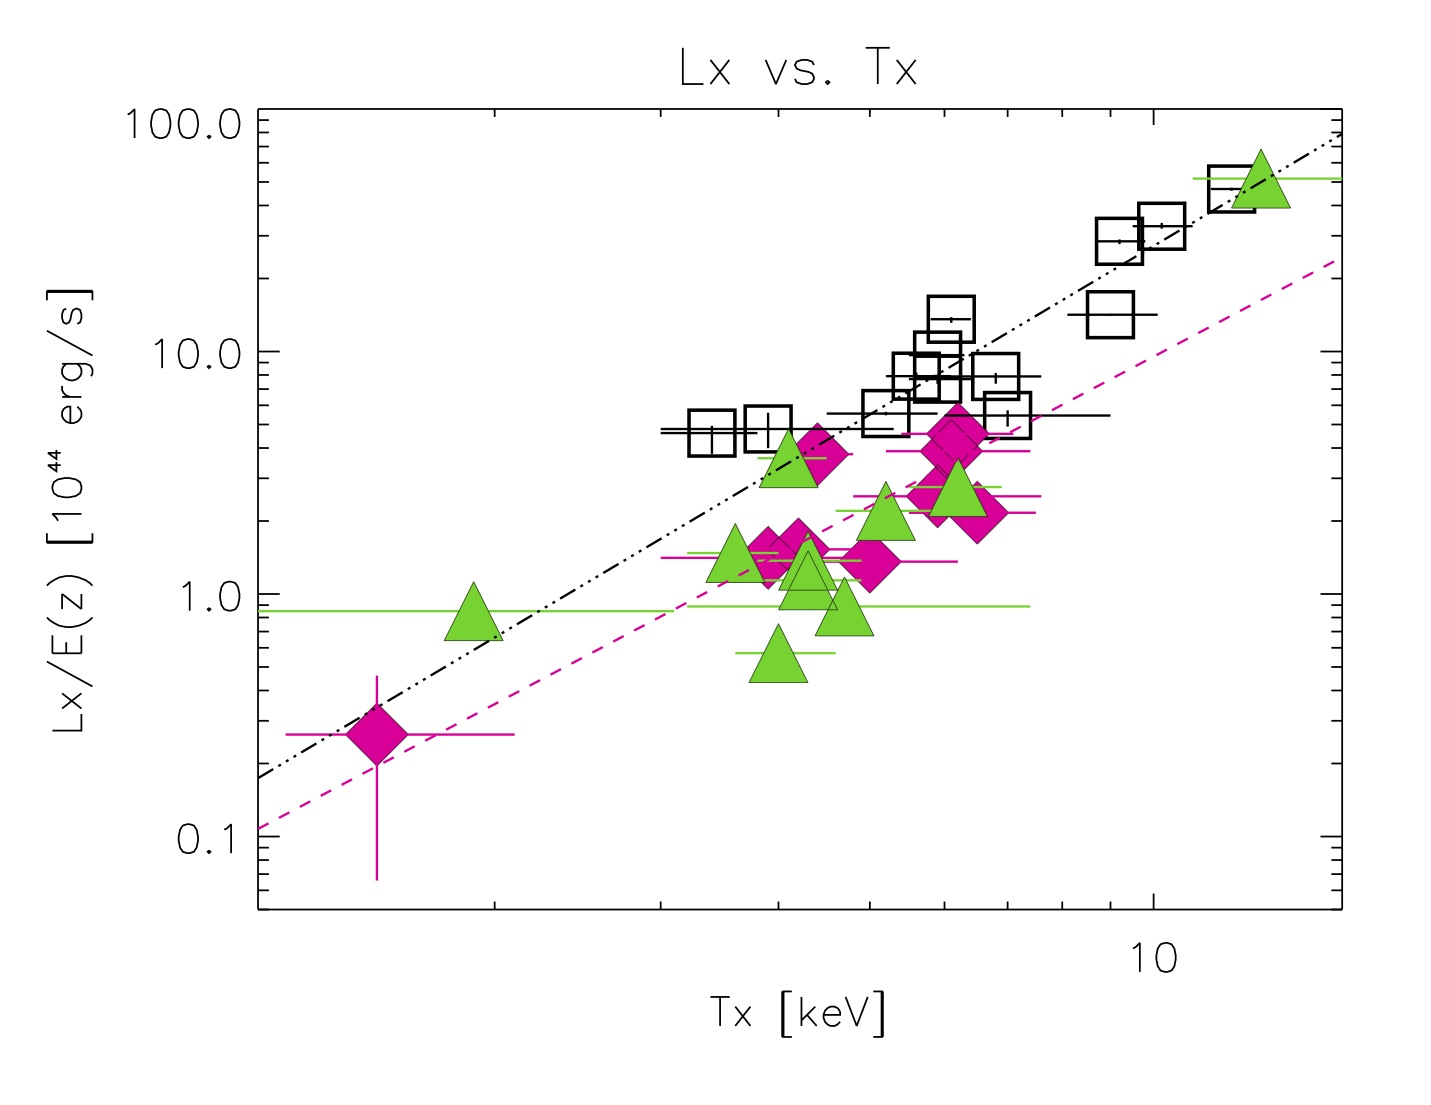
X-ray temperature vs. luminosity. Squares designate moderate-redshift X-ray selected clusters and diamonds represent high-z optically-selected clusters. Pink and black lines show best-fitting relationships for these two samples (Hicks et al. 2008). Green triangles mark our new sample of moderate-z optically-selected clusters, indicating consistency with our high-z sample. This confirms that selection bias, not redshift evolution, is responsible for the normalization discrepancy between the two relationships. (Hicks et al. 2011, in draft). |

 Research interests:
| A Very Massive High-redshift Cluster |
|
|
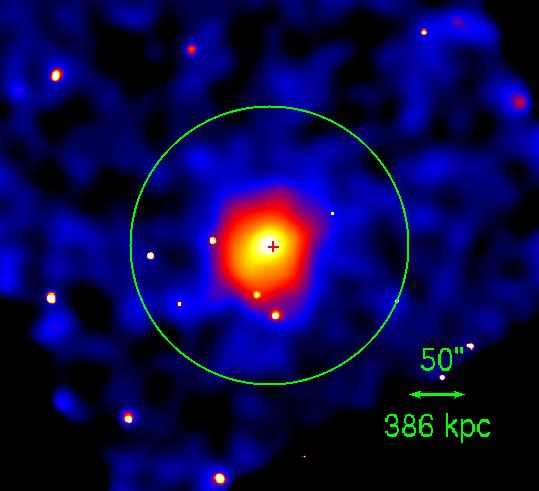
Adaptively smoothed Chandra ACIS-S image of SpARCS J161325+564930 (z∼0.9) in the 0.3-7.0 keV band. A ∼1 Mpc circle (∼R500) is centered on the cluster emission, and a red cross marks the coordinate of the brightest cluster galaxy. This is one of the most massive clusters (Mvirial ∼ 1e15 Msun) ever discovered at this distance. (Ellingson, Hicks et al. 2011, in prep). |
 Curriculum Vitae:
| Recent Star Formation in Brightest Cluster Galaxies (BCGs) |
|
|
NUV inferred star formation rate vs. central cooling time (at R=20 kpc). A line shows the best BCES regress bisector fit, with a slope of -3.9+/-0.7. This correlation proves conclusively that star formation seen in cool core cluster BCGs is directly related to cooling gas in the cluster cores. (Hicks, Mushotzky & Donahue 2010). |
|
|
| "Missing" Baryons in High-redshift Optically-selected Clusters |
|
|
Histogram of core gas mass fractions (Mgas/Mtot) for eight high-redshift optically-selected (pink) and nine moderate-redshift X-ray selected clusters (blue) with 3.5 < Tx < 8 keV. A K-S test indicates that the gas mass fractions of the samples are different at >99% confidence (Hicks et al. 2008). |
 Selected Preprints and Recent Papers:
 Selected Teaching/Educational Experience:
|