| X-ray Point Sources in the Field of RCS 0224-0002 |
|
| Hard (2.0-10.0 keV) X-ray point source regions are overlayed on an adaptively smoothed Chandra flux image of the high redshift (z~0.8) cluster RCS0224-0002. The large circle denotes a radius of R200 (1.14 Mpc). Within that region, six of the hard X-ray point sources are coincident with radio emission. AGN activity peaks at ~0.7 R200 and may inject enough energy into the intracluster medium (ICM) to significantly raise its entropy (Hicks et al. 2007). |
-
PDF file
- File Size: 4.2M
-
PDF file
- File Size: 294K
-
PDF file
- File Size: 656K
-
PDF file
- File Size: 338K
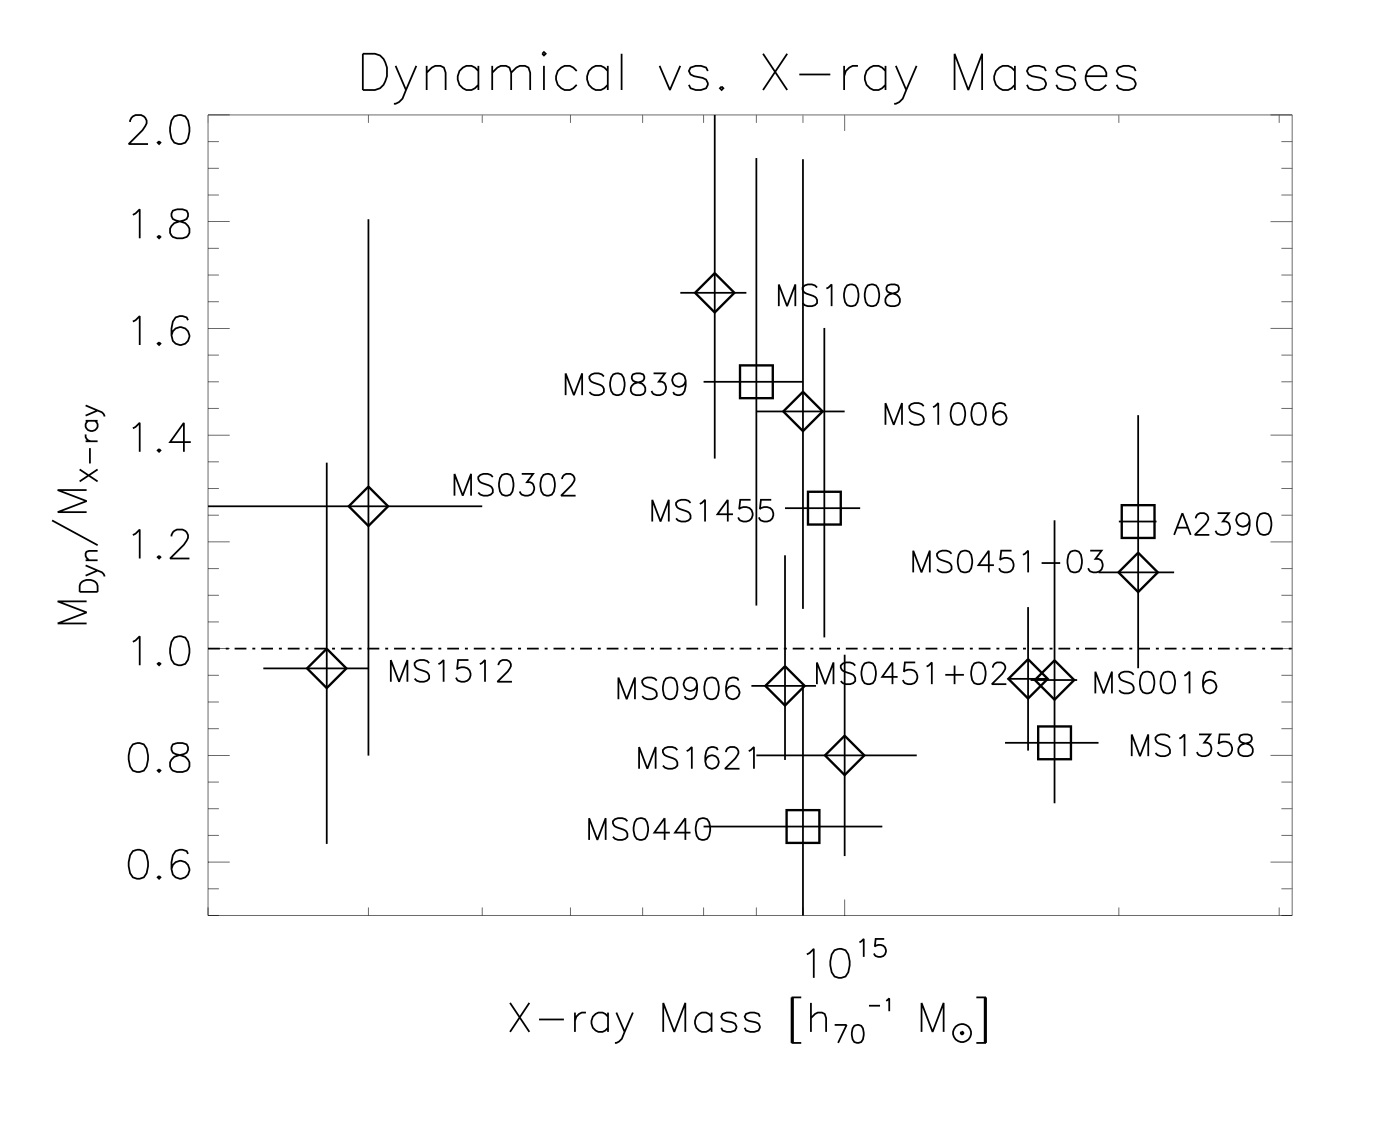
| Dynamical and X-ray Mass Comparisons |
|
| Dynamical vs. X-ray masses for the CNOC cluster sample. X-ray mass estimates are plotted against the ratio Mdyn/Mx. The dot-dashed line indicates a mass ratio of 1.0. Squares represent cooling core clusters and error bars denote 68% confidence limits. A weighted average gives an overall dynamical to X-ray mass ratio of 0.97 +/- 0.05. (Hicks et al. 2006). |
-
PDF file
- File Size: 111K
-
PDF file
- File Size: 465K
-
PDF file
- File Size: 817K
-
Gzip Postscript file
- File Size: 24M
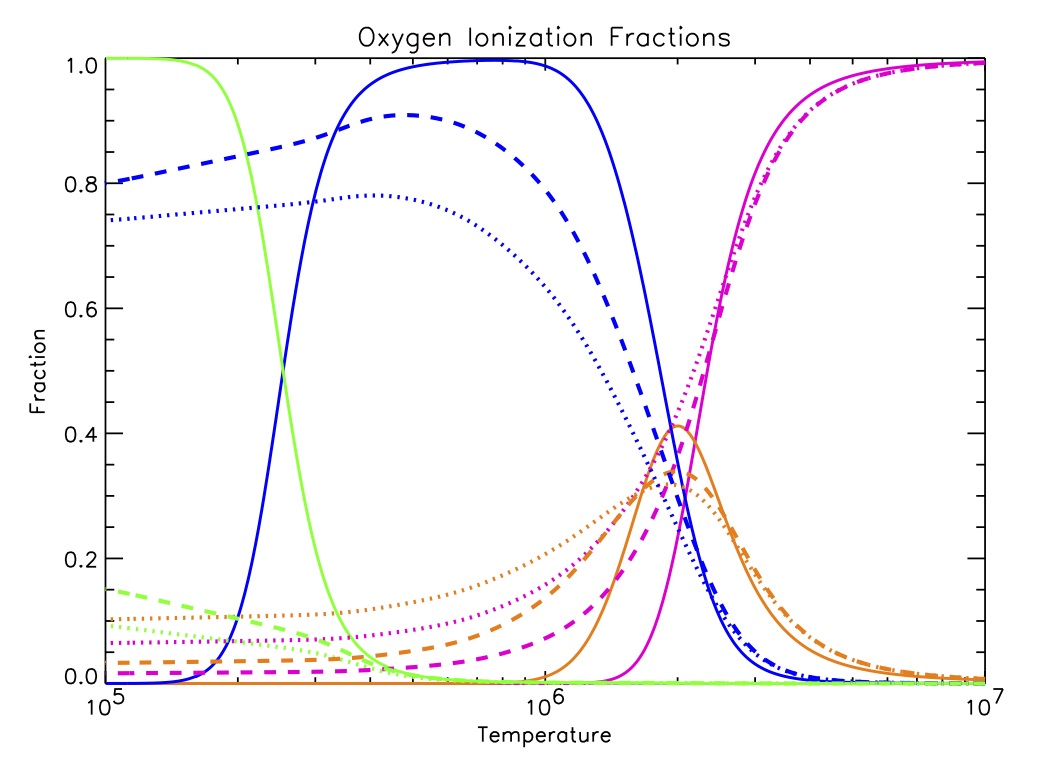
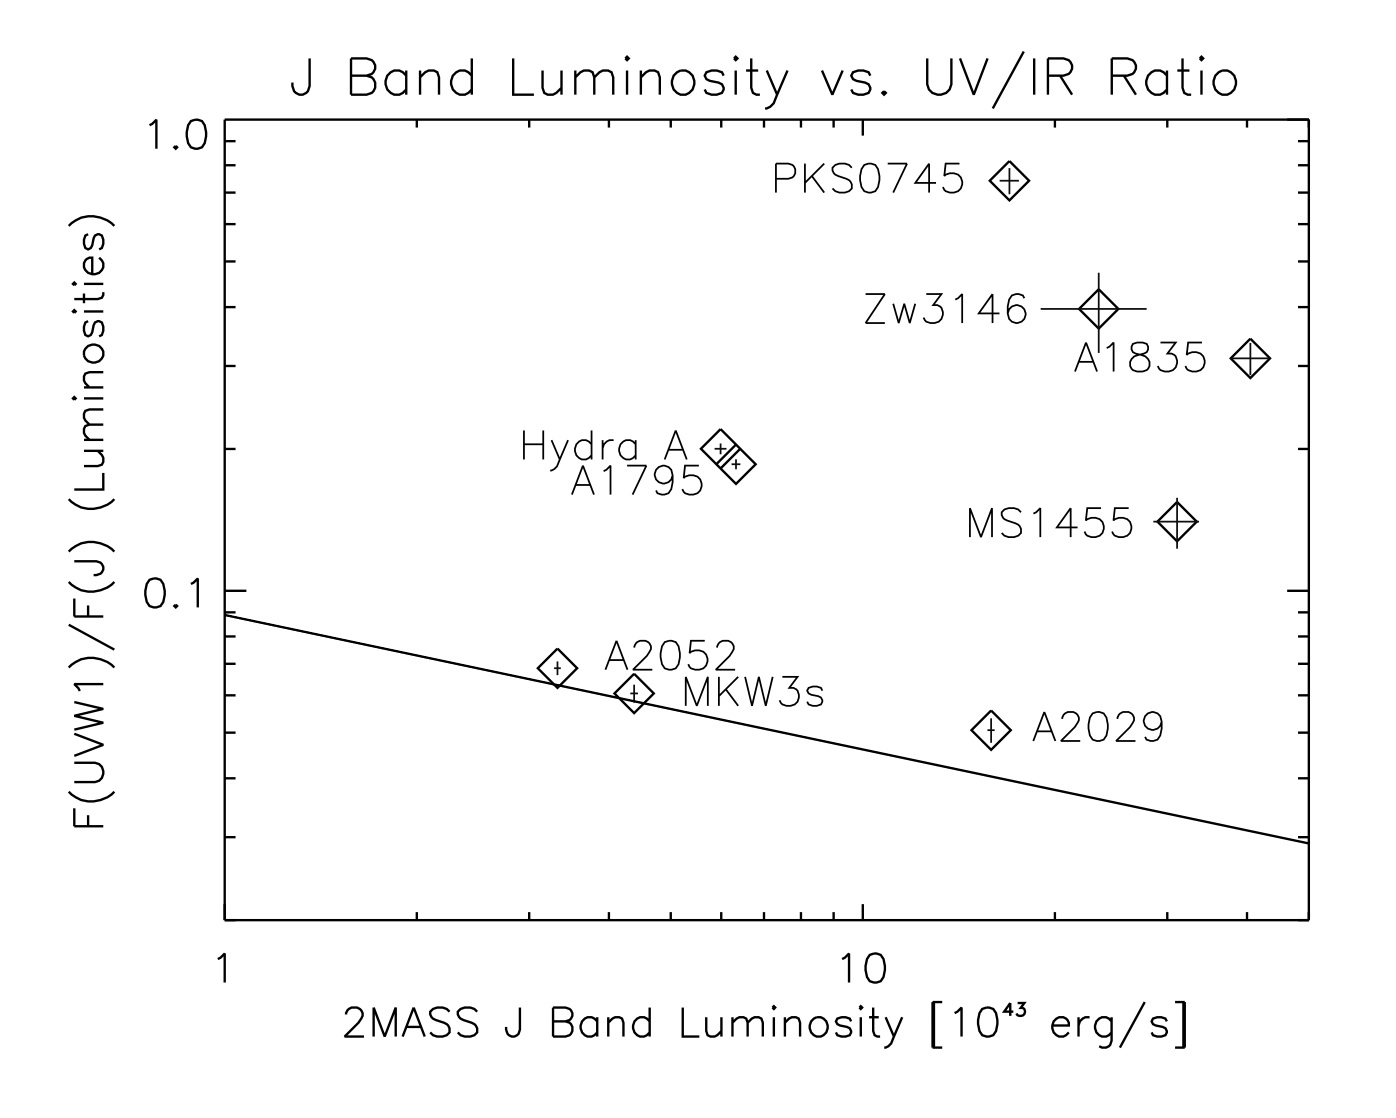
| Excess UV Emission in Brightest Cluster Galaxies (BCGs) |
|
| UV/IR luminosity ratio vs. 2MASS J-band luminosity. All luminosities were calculated in 7 arcsec radius regions and corrected for Galactic extinction. Diamonds indicate cool core cluster BCGs. The line designates the best-fitting relationship between UV and IR luminosity for passively evolving and non-cool core BCGs. The high UV/IR ratio of the cool core BCGs is a strong indication of the existence of hot young stars and thus a direct indication of copious recent star formation. (Hicks & Mushotzky 2005). |
-
Gzip Postscript file
- File Size: 617K
-
Microsoft PowerPoint file
- File Size: 530K