FOGGIE simulations! This is the Tempest halo from the Figuring Out Gas & Galaxies In Enzo (FOGGIE) project (PI: Molly Peeples). The simulations were evolved on NASA's Pleiades supercomputer, and the visualizations were created in collaboration with the NASA/Ames High-End Computing Capability (HECC) Visualization and Data Analysis Services team.
Evolution of circumgalactic and interstellar neutral hydrogen in a Milky Way like halo. View of the gas in and around an evolving galaxy, with the brighter pinker colors indicating more neutral hydrogen and the darker browner colors indicating regions lacking neutral hydrogen, either because they have less gas overall or are more highly ionized. In general, the system becomes more ionized (less neutral) with time. Most of the neutral hydrogen can be seen flowing into the forming galaxy cosmic filaments or in the galaxy itself, but small neutral clouds are also seen flowing out of the galaxy as part of galactic superwinds. Many of these small clouds orbit the galaxy before falling back into the main disk, which at late times is a neutral gas rich warped spiral.
Evolution of circumgalactic and interstellar gas temperature in a Milky Way like halo. View of the gas in and around an evolving galaxy. The colors indicate temperature, with the bluer colors tracing the cold gas that predominantly flows in from the cosmic web and at late times can be seen to form a warped galactic disk. The yellow to red colors trace the hotter gas that is primarily generated by explosive supernovae deep within the galaxy that blow material far out into the circumgalactic medium.
Evolution of circumgalactic and interstellar gas density and temperature in a Milky Way like halo. View of the gas in and around a simulated evolving galaxy. The purple-to-yellow colors indicate the gas density, with the purple tracing lower density gas and the yellow tracing higher density gas. The blue-to-red colors indicate gas temperature, the redder colors tracing the hotter gas. The colder, denser gas flows in along cosmic filaments to form the galaxy, where stars (not shown) are forming. These stars then blow up as supernovae that drive galactic superwinds from the galaxy; these are seen predominantly as the hotter diffuse gas blowing out of the galaxy. As there is more star formation and thus more supernovae at early times, these winds become calmer as the galaxy evolves.
This movie is a fly-through of an evolving population of galaxies in the early universe, made from the Renaissance Simulations (e.g., O'Shea et al. 2015 and many other papers). The simulation is made by the NCSA Advanced Visualization Laboratory, and narrated by me. It shows how star formation and feedback is intermittent in galaxies in the early universe, and also breaks down the movie (a mult-field volume rendering) to show where hot gas, metals, neutral hydrogen, and other components are located (and often co-located).
The movie below (created by Britton Smith) shows the formation of the first metal-enriched star in the universe, and comes from our paper "The first Population II stars formed in externally enriched mini-haloes", by Britton Smith et al. The left panel shows the gas density and the right panel shows the temperature. The first Pop III star forms at redshift 23.7 and shines for roughly 4 Myr before exploding as a core-collapse supernova, at which time the right panel changes to show the metallicity. About 60 Myr after the first supernova, the movie zooms in on the formation site of the second Pop III star. Shortly after it explodes, the supernova blast-wave collides with a nearby halo moving in the opposite direction. The passing blast-wave and a merger event induce turbulence, which allows the metals from the supernova to mix into the center of the halo. The movie then continues to zoom in to follow the dense gas in the core of the halo as it undergoes runaway collapse. For much of the collapse, we only see the central core become smaller and denser. Eventually, dust cooling becomes efficient, causing the gas to cool quickly and fragment into multiple clumps. The movie ends at a scale of 100 proper AU looking at the pre-stellar cores that will go on to form the first low-mass stars. I strongly suggest watching this movie in "full screen" mode, and you can also see it on vimeo.com.
A movie of the evolution of 24 high resolution dark matter-only simulations of the formation of Milky Way-sized galaxies. This movie was produced by my collaborator Dr. Brendan Griffin as part of the Caterpillar Project. The Caterpillar Simulations are high resolution dark matter simulations of the formation of Milky Way-sized galaxies, and are intended to be the platform for a wide variety of studies relating to galaxy evolution. The movie embedded below shows the evolution of these dark matter halos over the age of the universe, and it highlights the differences in formation history between galaxies that will, at the present day, be approximately the same mass. (Note: the movie is best viewed full screen and at the highest possible resolution.)
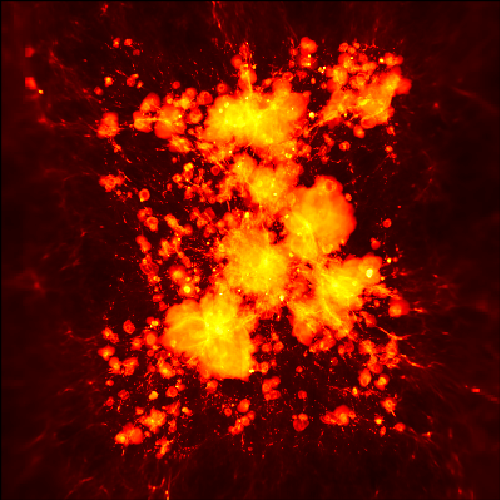
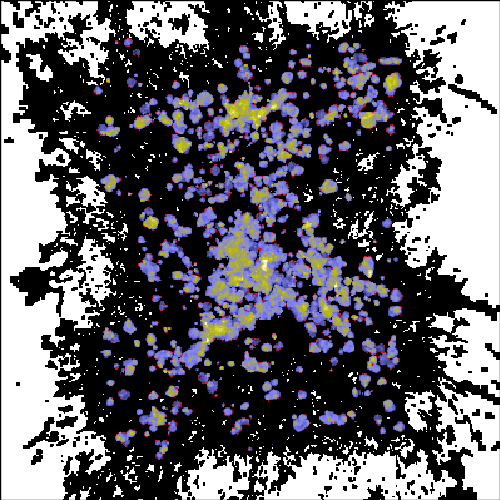
Several images from the Blue Waters "rare peak" galaxy formation simulation, first presented by Xu et al. and Chen et al.. These images show (in order of appearance) the projection of baryon density, baryon temperature, and metallicity along the line of sight through the adaptively refined region of the simulation. The HII regions surrounding these galaxies, as well as the metal-enriched outflows from the same objects, can clearly be seen. (Images c/o Hao Xu, Pengfei Chen, and Michael Norman at UCSD; John Wise at GATech; and Brian O'Shea at MSU).
A variety of movies and images from an Enzo AMR cosmology simulation,
showing baryon properties as well as grid structure. This
includes both movies and stills for the entire simulation
volume and also movies/stills that zoom in on a single
Click on the image below to go to a page of movies, images,
Enzo parameter
files, and yt scripts from
this simulation.
Movies that illustrate the
behavior of Enzo's
block-structured adaptive mesh refinement capabilities using the
Sedov-Taylor and Kelvin-Helmholtz test problems. Click on
each of the
images below to go to a page of movies, Enzo parameter
files, and yt scripts for
each test problem.


Video of a set of simulations showing the birth, life, and death of the very first star in the (simulated) Universe. Visualization by Matt Turk, Sam Skillman, John Wise, and Mark SubbaRao. Simulations by Matt Turk, Jeff Oishi, Tom Abel, Greg Bryan, John Wise, and myself. See the text accompanying this video on youtube for more information. (Also, make sure to watch this in HD!)
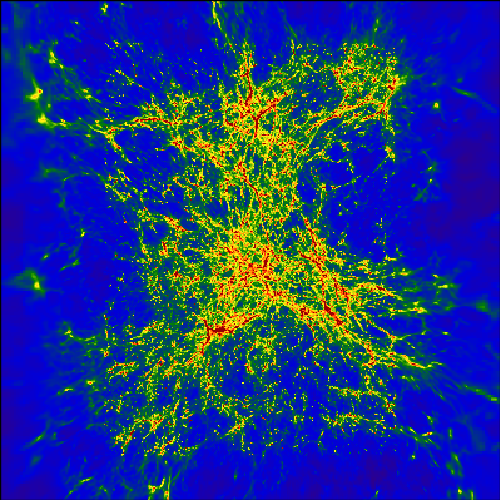
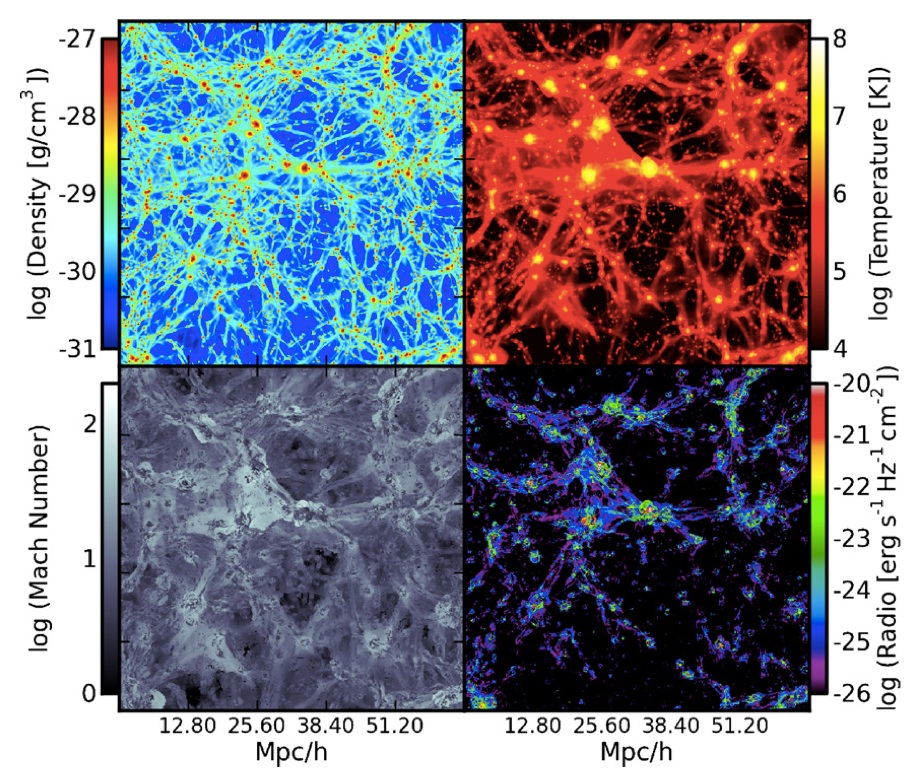
The images shown below, from the paper "Galaxy Cluster Radio Relics in Adaptive Mesh Refinement Cosmological Simulations: Relic Properties and Scaling Relationships", by Sam Skillmen et al., shows a snapshot of the universe at the present day in (clockwise from top left) projected baryon density, temperature, 1.4 GHz radio emission, and shock mach number. The top image is of a region 64 Mpc/h across, and the bottom image is of a region 16 Mpc/h across.

Videos of a simulation of the formation of a Milky Way-like galaxy, done by me using the Enzo code and visualized by the NCSA Advanced Visualization Laboratory, are featured on the James Webb Space Telescope Website. The movies are embedded below.
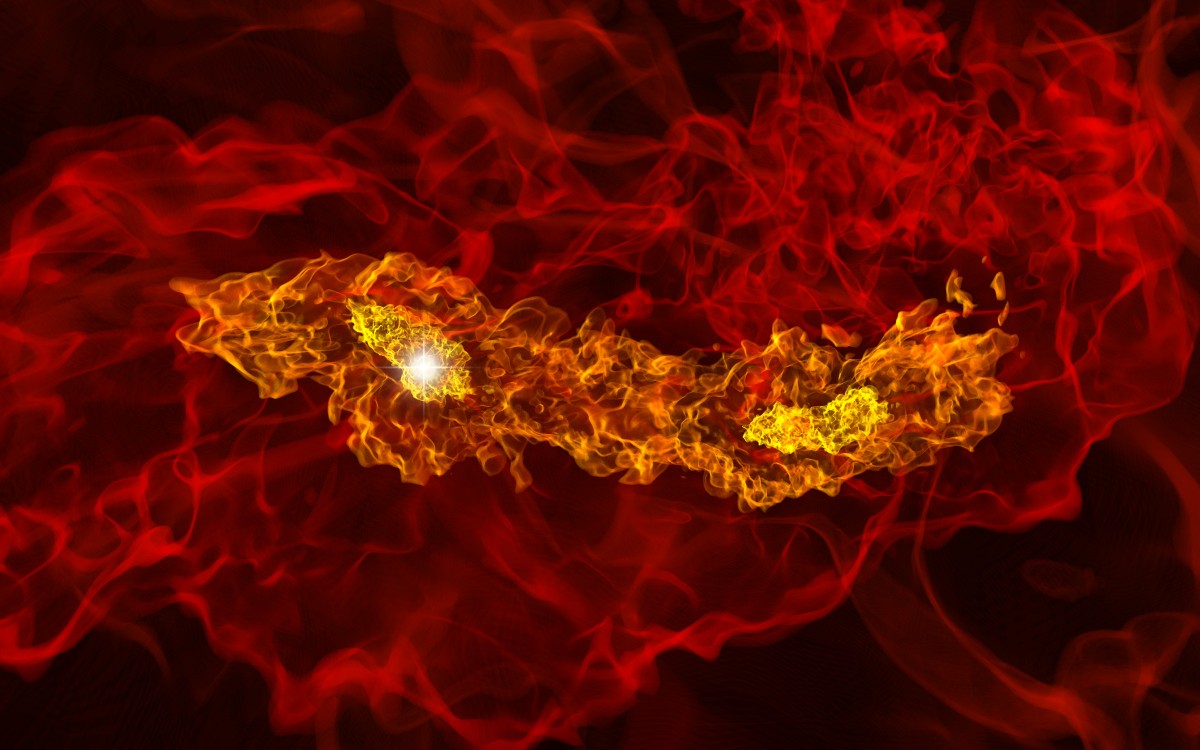
The image shown below is a volume rendering from a simulation of the formation of a
binary Population III stellar system. Population III stars are the first
stars to form in the universe, and contribute to the formation of galaxies
like our own Milky Way. In this image, the field of view is about 2,000
astronomical units across (one astronomical unit is the distance between
the Earth and the Sun, or about 93 million miles). The two yellow clumps
are the gas clouds in which the two stars are being born. The image shown
below is
taken from a simulation done by Matthew Turk, Tom Abel, and Brian O'Shea, and
was part of a research project that was published in the journal Science. The image was created by Ralf Kaehler.
(Click on the image to view a larger version.)
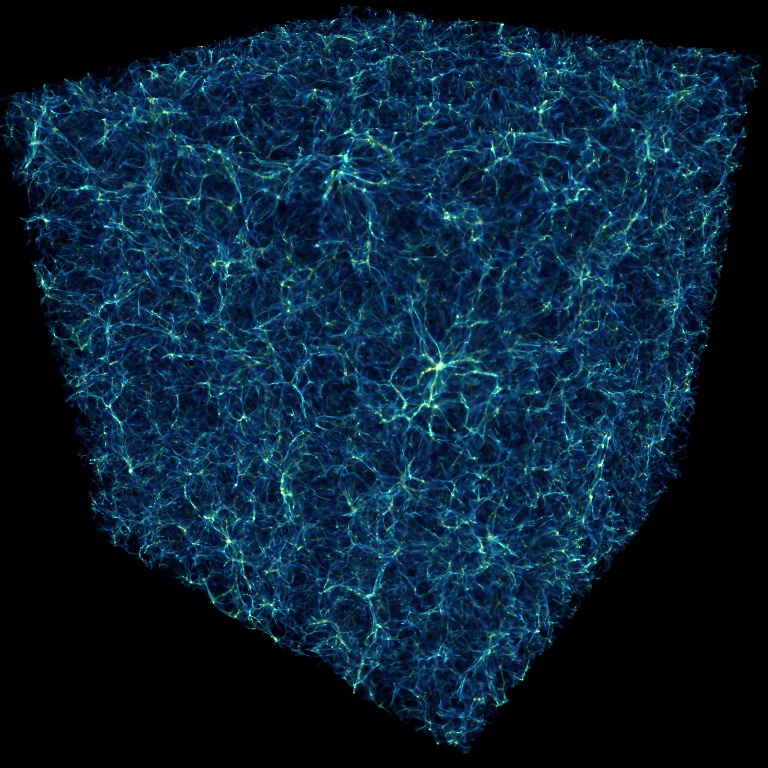
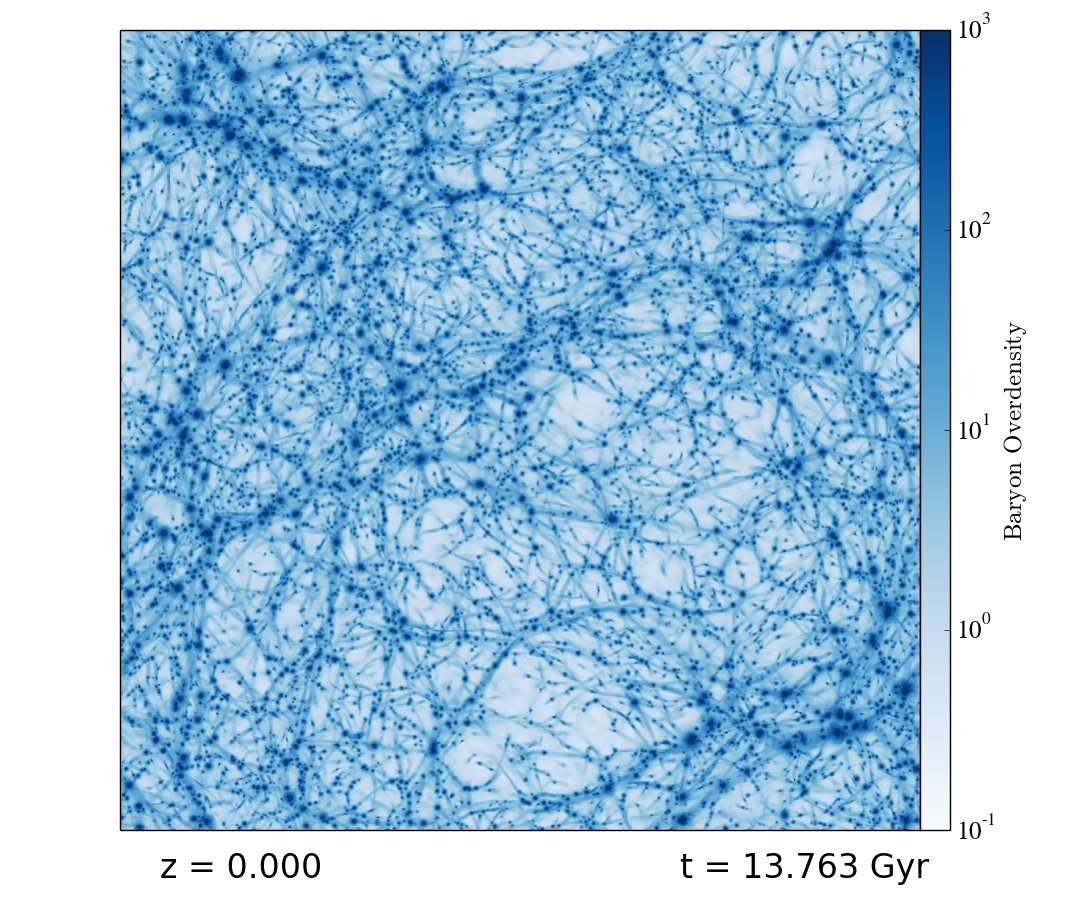
The image shown below is a volume rendering from one of the
largest AMR cosmological simulations done to date, and shows structures
in the universe on the largest scales. The field of view is approximately
two billion light years across, and the image shows the the "cosmic web" of
filaments that are formed, and the clusters of galaxies that form at the
intersection of these filaments. This simulation has been used
as a part of
three
research
projects
that have all been published in
The Astrophysical Journal.
The image was created by
Matt Hall at the
National Center for Supercomputing Applications.
(Click on the image to view a larger version.)