Simulations
 Emerging Flux Simulations
 96 Mm wide Magneto-Convection
 Hi-Resolution (6 km) Magneto-Convection
 Solar Surface Hydrodynamic Convection
Minimally structured, uniform, untwisted, horizontal magnetic field is advected into the computational domain by inflows at the bottom. The domain is 48 Mm wide by 20.5 Mm deep, extending from the temperature minimum down to 20 Mm below the visible surface.
First, the magnetic field was slowly increased both at the
boundary and in the interior proportional to the magnitude of the
existing field with an e-folding time of 5 hours from an initial
boundary magnitude of 0.2 kG until it reached 10 kG, Run
mhd48-0.
Second, new runs, with constant inflow boundary magnetic field
magnitude at the bottom, were branched off of the initial run when
the boundary magnetic field reached 1 kG, Run
mhd48-1, 5 kG, Run mhd48-5, and 10 kG, Run mhd48-10.
| Time (hrs) | B (kG) bottom inflows |
Run increasing B |
Runs constant B |
Times (hrs) | ||
| 0 | 0.2 | mhd48-0 | ||||
| | | ||||||
| 11.5 | 1 | | | \ | |||
| | | \ | mhd48-1 | 11.5-65.4 | |||
| 19.6 | 5 | | | \ | |||
| | | \ | mhd48-5 | 19.6-48.8 | |||
| 23 | 10 | | | \ | |||
| \ | mhd48-10 | 23-23.4 |
The Y-AXIS is the VERTICAL direction, pointing downward.
The x-axis points east and the z-axis points north.
The coordinate system is rotating at a rate corresponding to a lattidute of North 30 deg.
Runs have different dimensions: 504x500x504, 1008x500x1008 and 2016x500x2016, with resolution
96, 48 and 24 km respectively horizontally. Vertical resolution is 12-80 km for all.
Horizontal boundaries are periodic. In the vertical direction there are 5 ghost zone boundary layers at top and bottom that are unphysical. In IDL the vertical physical region is iy=5,494.
The units are:
     length: Mm=10^8 cm
     density: 10^-7 g/cm^3
     time: 100 sec
     magnetic field: kG
Thus derived unts are:
     velocity 10 km/s
     pressure 10^5 dyne/cm^2
     energy per unit mass 10^12 erg/gm
     flux 10^11 erg/cm^2/s
The grid is staggered with scalar variables: density, energy, temperature, pressure defined at the integer cell
     centers.
     The vectors: momenta, velocity, magnetic field are defined at the integer-1/2 faces.
     The vectores: electric field, current are defined at the cell edges.
After 37.65 hours of purely hydrodynamic convection, a very weak (100 G) minimally structured, uniform, untwisted, horizontal magnetic field is advected by inflows at the bottom into a computational domain 96 Mm wide, extending from the temperature minimum down to 20 Mm below the visible surface. Horizontal slices of velocity, magnetic field at optical depths 1, 0.1, 0.01 plus the emergent intensity are available in Slices_mhd. The goals of this simulation are: (1) Provide a data set for evaluation and improving local helioseismology; (2) Investigate the relation between local surface dynamo action and the global solar dynamo. This sequence of calculations is continuing.
| Time (hrs) | B (G) bottom inflow |
Slices |
| 0-37.65 | 0 | Slices_hydro |
| 37.65-108 | 100 | Slices_mhd |
Magneto-convection with an initial uniform weak vertical field (10 G) was initiated in a domain 12 Mm wide by 6 Mm deep. The field strength is slowly increased with an e-folding time of 2 hours. The resolution was 12 km horizontally and 6-24 km vertically. Once the average vertical field reached 280G it was held constant and the horizontal resolution was increased to 6 km and run for an additional 11 min to produce the final data set with B vertical vertical of 280G, which is labeled 6km_358.
| Time (hrs) | B (G) Average Vertical |
Run increasing B 12 km resolution |
Runs constant B 6 km resolution |
Times (hrs) | ||
| 0 | 10 | mhd12v | ||||
| | | ||||||
| 6.23 | 60 | | | \ | |||
| | | \ | mhd12v/60G | 6.23-6.58 | |||
| 9.51 | 280 | | | \ | |||
| | | \ | mhd12v/280G | 9.51-9.9 |
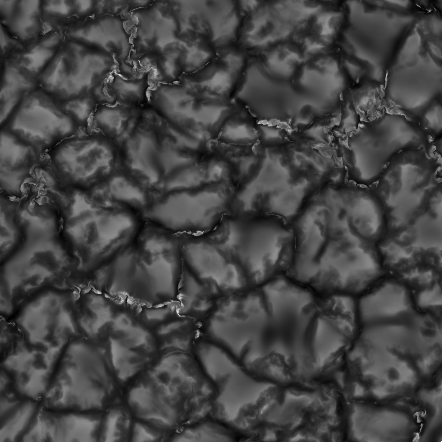
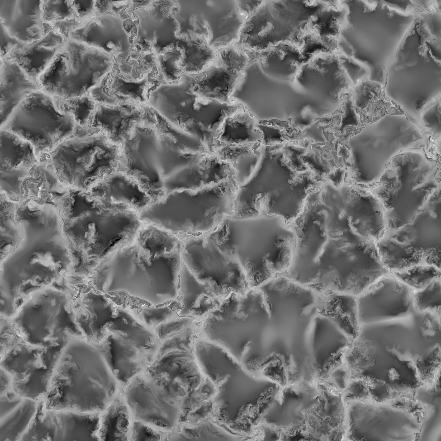
Emergent intensity (left) and vertical velocity (right) unipolar simulation. Average unsigned B = 60 G, resolution = 6 km horizontally.
Super supergranulation scale hydrodynamic convection (96 Mm wide by 20 Mm deep) data is available here. There are velocity slices plus 4 hour temporal averages (with 2 hour cadence) of the entire volume for the velocity, density, internal energy, temperature and sound speed. The duration is 39.0 hours so far.
The simulation was started by doubling, in the horizontal direactions, a 48Mm wide by 20Mm deep simulation whose duration was 70 hours, with a small added perturbation to break the symmetry. The 48 Mm wide simulation had similarly been started by doubling a 24 Mm wide run whose duration was 171 hours, which was started from a 12 Mm wide run whose duration was 24 hours. The turnover time from 20 Mm is 2 days, so these earlier runs went for 6 turnover times.
Horizontal slices of vertical velocity at 6 depths showing increasing convective cell size with increasing depth.
Granule scale hydrodynamic convection simulations are found here.
This research is/was supported by NASA grants NNX07AO71G, NNX07AH79G, NNX08AH44G, and NSF grant AST-0605738. The calculations were performed on the NASA Advanced Supercomputing Division "Pleiades" computer. Any opinions, findings, and conclusions expressed in this material are those of the author(s) and do not necessarily reflect the views of NASA or the NSF.
This page has been accessed times.
Updated: