


|
|
|
|
|
|
| Exp Time |
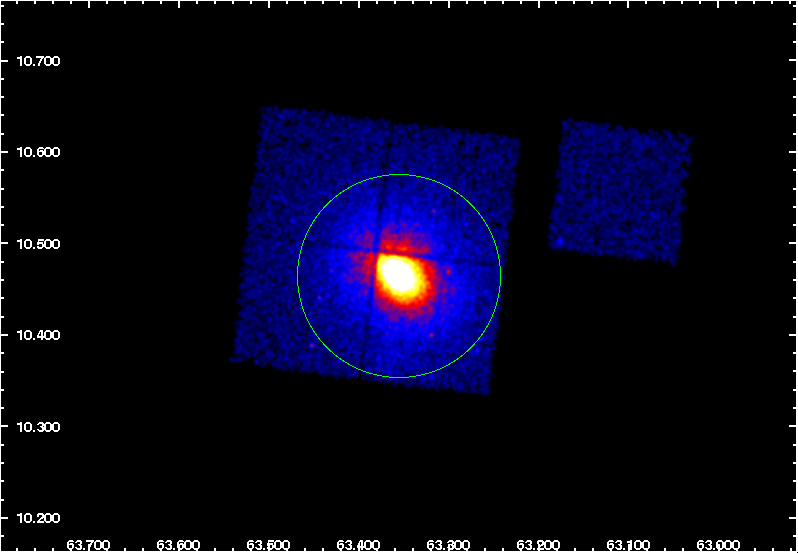
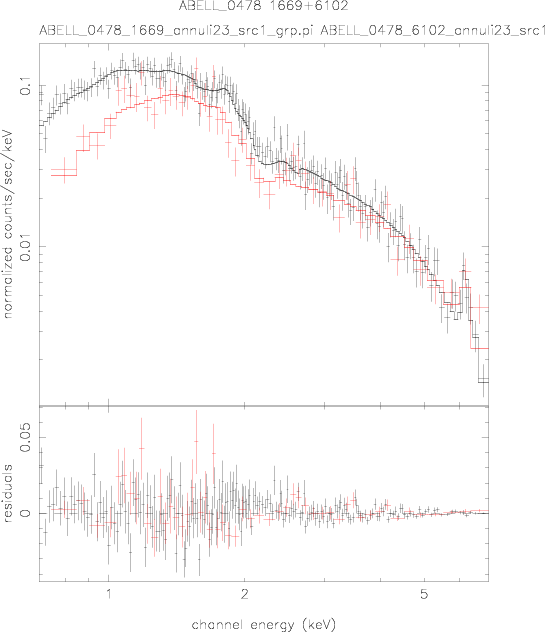
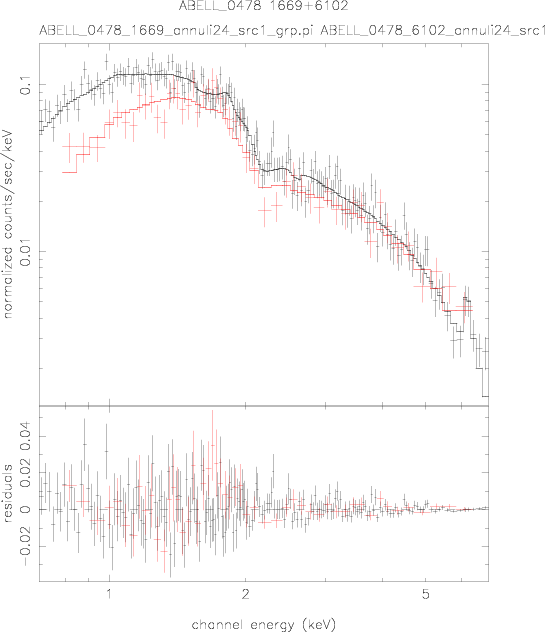
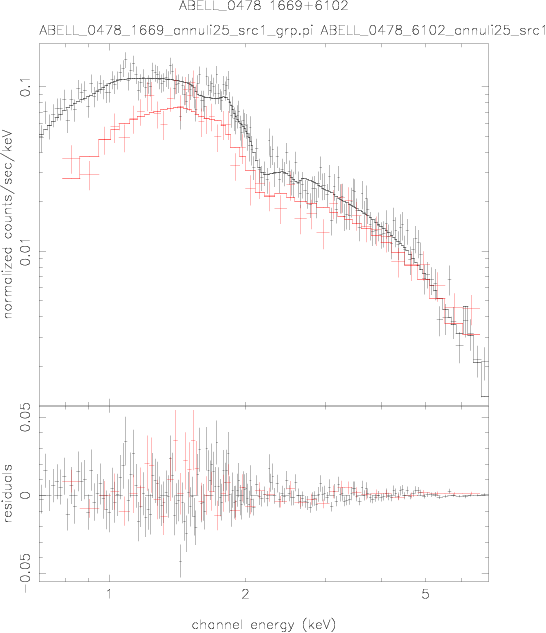
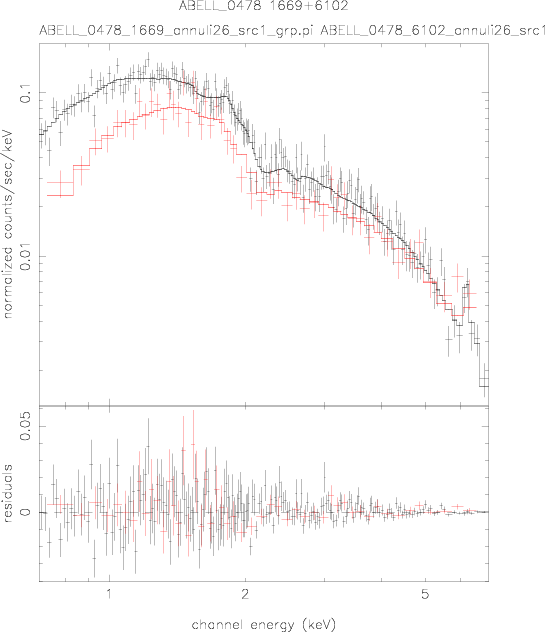
R.A. | Decl. | NH | z | Rmax | Min. cts. | TX | Abund. | Lbol |
|---|---|---|---|---|---|---|---|---|---|
| ksec | hr:min:sec | deg:min:sec | 1020 cm-2 | --- | pixels | counts | keV | Solar | 1044 ergs/s |
| (1) | (2) | (3) | (4) | (5) | (6) | (7) | (8) | (9) | (10) |
| 10.0 | 04:13:25.345 | +10:27:55.15 | 30.90 | 0.0883 | 812 | 20000 | 7.07 | 0.31 | 16.700 |
|
|
|
|
|
|
|
|
|||||||||||||||||||||||||||||||||||||||||||||||||
|
|
|
|
|
|
|
|
|


![[Valid RSS]](https://web.pa.msu.edu/astro/MC2/accept/valid-rss.png "Validate my RSS feed")


© Copyright 2007-2009 Kenneth W. Cavagnolo
Except where explicitly stated, all rights are reserved and
content should not be copied, adapted, redistributed, or
otherwise used without the prior written permission of Kenneth
W. Cavagnolo. Any unauthorized publication, copying, hiring,
lending or reproduction is strictly prohibited and constitutes a
breach of copyright.