Next: Get X-ray PDF Up: GUI Widgets Reference Previous: GUI Widgets Reference Contents
When reading a SPEC data file, the program only looks for the scan
starting identifier ``#S'', the column description identifier
``#L'', and the following data of each scan. ``#S'' and ``#L''
must exist for each scan, and are the only header
information checked by the program. The scan number immediately
following the ``#S'' should be unique throughout the file. The blank
space is the default field separator. After you read in the data, all
the parameter values will be set to defaults (which are usually wrong,
e.g. the first column will be set to be Q/2![]() as the
default. The scans list in the GUI will tell you how many points in
each scan, and the Q/2
as the
default. The scans list in the GUI will tell you how many points in
each scan, and the Q/2![]() data range. The last field in the scan
list is an indicator of whether that scan will be used during
merging. The default is to use all the scans which has more than one
point. When you highlight some or all the scans in the list, the
column names that are common to all the highlighted scans will be
shown as available columns for selection. As you may notice the change
of values in Q/2
data range. The last field in the scan
list is an indicator of whether that scan will be used during
merging. The default is to use all the scans which has more than one
point. When you highlight some or all the scans in the list, the
column names that are common to all the highlighted scans will be
shown as available columns for selection. As you may notice the change
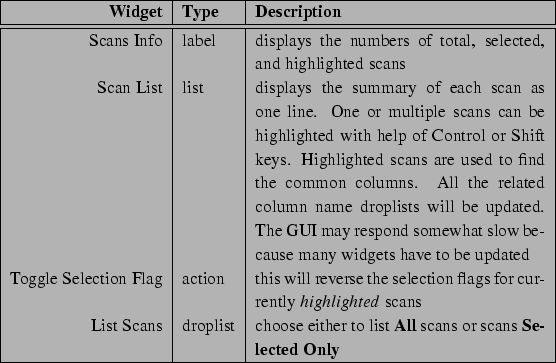
of values in Q/2![]() , monitor column droplist and others. The
label on top of the scan list gives a brief overview of current scan
data status. See Table 3.3 for details.
, monitor column droplist and others. The
label on top of the scan list gives a brief overview of current scan
data status. See Table 3.3 for details.
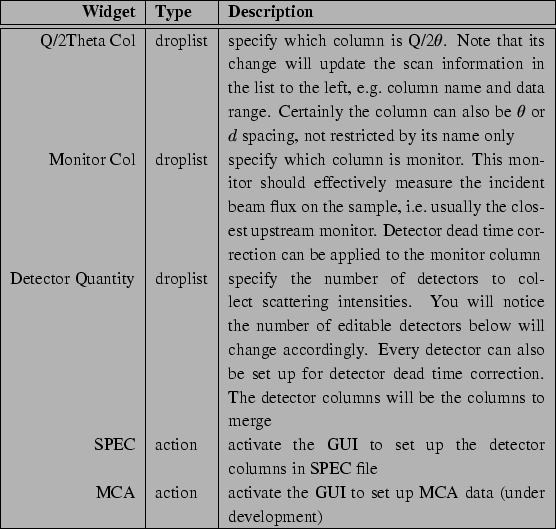
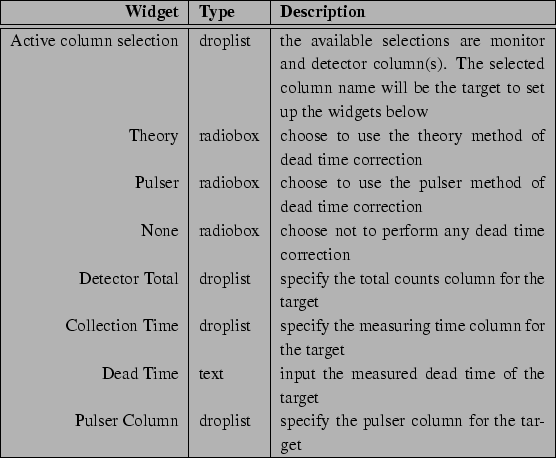
Columns in the scan data are identified by their names after the
``#L''. The column names shown in the droplists are the common
column names of the currently highlighted scans. The GUI
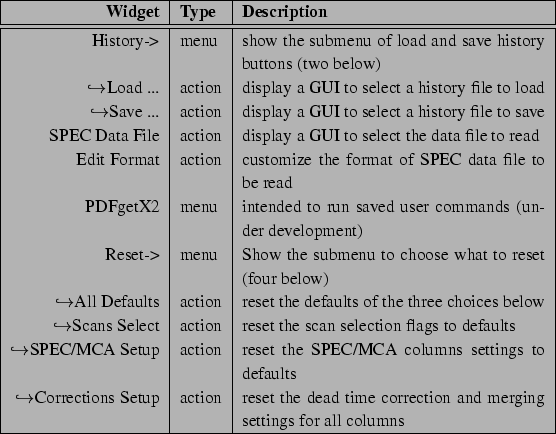
operation should be mostly self-explanatory, with descriptions in
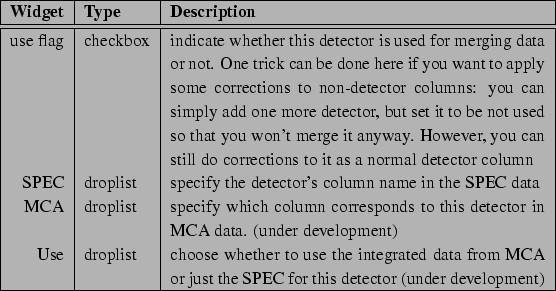
Table 3.4. For each detector you can specify whether
it'll used during merging, its column in the SPEC data file, and its
column in MCA data file (Table 3.5).
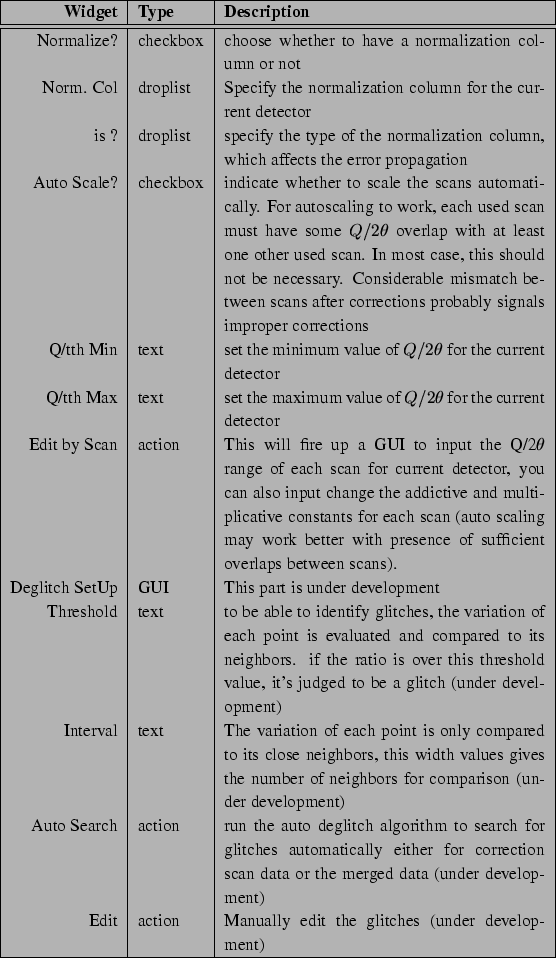
Before merging the scans, you may need to do two things. i) normalization by the monitor counts or measurement time point by point; ii) remove the spurious features sometimes appearing at the ends of scans. Please refer to Table 3.1.4 for usage. One feature still under development is the automatic removal of the spurious single bin-width noise spikes from the electronics.
Xiangyun Qiu 2004-04-23