Subsections
The top frame of the GUI shows some general settings, as explained in
Table 3.2. Please refer to Table 3
for the column descriptions in all tables.
Table 3.9:
Descriptions of the GUI top frame of Get X-ray PDF
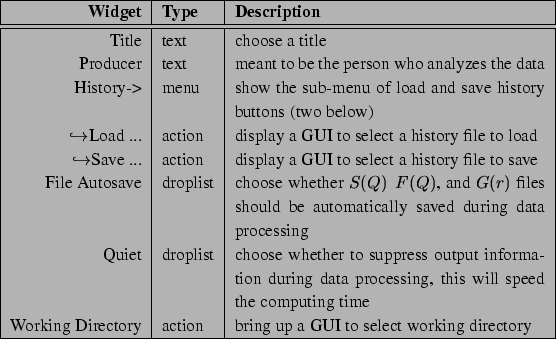 |
You can specify the file format by clicking on the
Customize... button. Please see
Appendix B for all supported file formats. It
should be straightforward to load data and background files. One
restriction is that the four kinds of file (sample, sample background,
container, container background) must have exactly the same format,
but can have different number of data points. In the case of multiple
scans in SPEC format, each scan is considered as the merged data for
one detector. Data from more than one detectors will be blended
together to get I(Q). For each detector, some degrees of freedom is
provided for both sample and background data. Table 3.2.1
shows the descriptions, noting that they only become editable after
data files are read successfully (by clicking on the Get
I(Q) button).
Table 3.10:
Descriptions of the GUI to input and edit data files
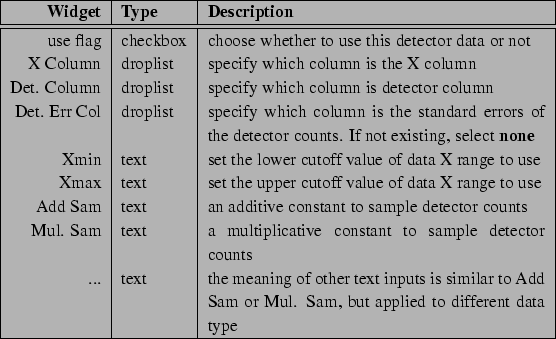 |
In this section, X-ray wavelength and polarization factor can be
selected from some predefined values, or entered manually when
choosing type as Customize .... In case of non-polarized
X-ray (in-house source), you will be asked to input the monochromator
information, such as the crystal type, where it's positioned, and the
d-spacing of the reflection plane used.
The absorption coefficient of the container only becomes important when
it's large. When a filter is used after the sample (either to suppress
the fluorescence or Compton contributions), the absorption of the
filter is needed if elastic scattering is also significantly
attenuated. Others are optional, mostly for the purpose of keeping a
good record.
Table 3.11:
Descriptions of the GUI to set up sample information
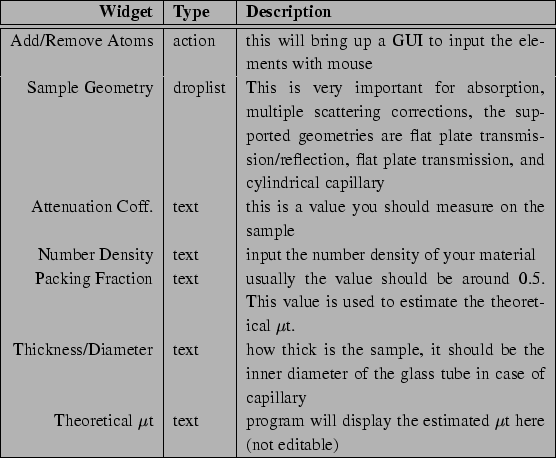 |
In this section, you need to input the chemical compositions of your
sample. First thing you need to do is to specify the elements. See
Table 3.2.3 for details.
Table 3.12:
Descriptions of the GUI to set up S(Q) corrections (I)
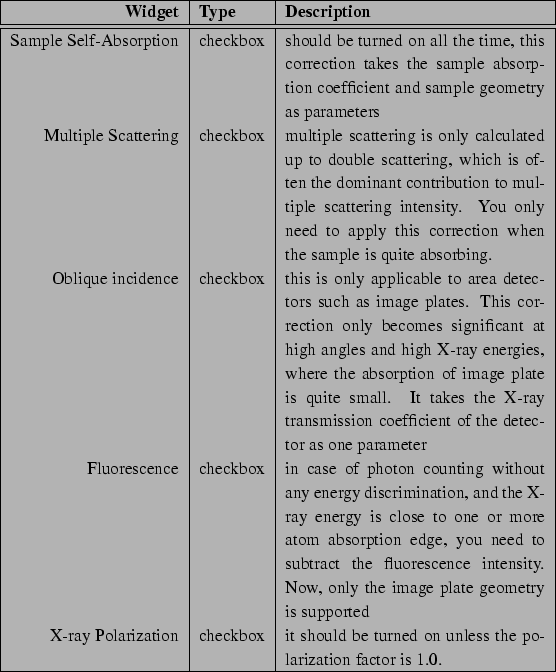 |
Table 3.13:
Descriptions of the GUI to set up S(Q) corrections (II)
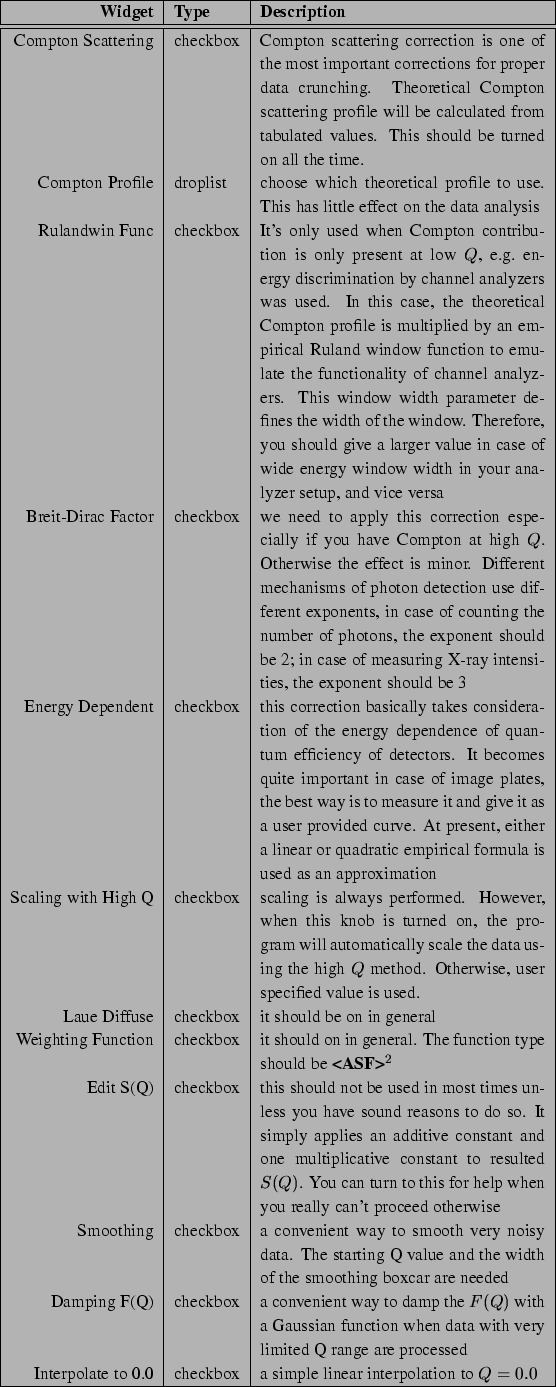 |
This GUI section tells the program what corrections to apply, as well
as some parameter values. It's not as complicated as it may look
like. At this moment, only the Generic correction method is
implemented. So keep it set all the time. For all other corrections,
please see Table 3.2.3 and 3.2.3.
Under the GUI section of G(r) Optimization, what's of most
interest is the range of S(Q) to use and the range of G(r) to
generate. It should be straightforward to input those values. In
particular, Qgrid of 0.0 means all Q values in the data will
be used (either regular or irregular).
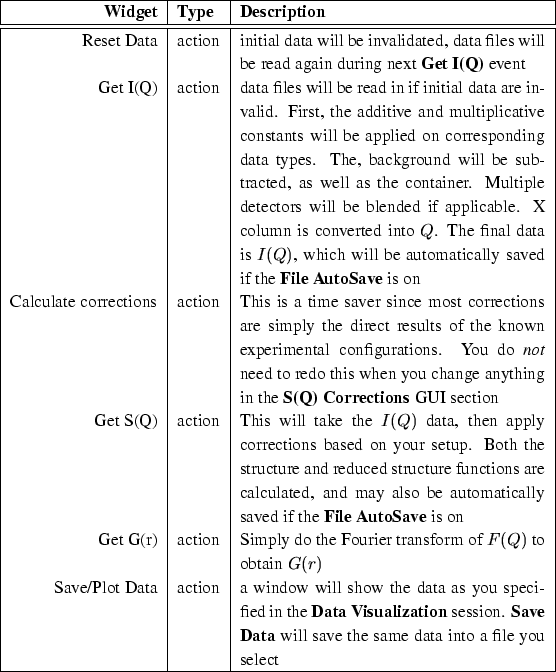
Data visualization has bee described in details in
Section 2.4.9. Data processing is triggered by the row
of buttons near the bottom. What they do is explained in
Table 3.2.6.
Table 3.14:
Descriptions of the GUI to visualize data and process data
 |
The last row of the GUI is User Message, which displays some
information during the data processing, as well as warning or error
messages. When running on Linux/UNIX platforms, the program also
writes messages to the terminal.
Xiangyun Qiu
2004-04-23