Diffuse scattering: Short range order
Diffuse scattering
Thermal I
Thermal II
Occupational I
Occupational II
Longitudinal waves
Transversal waves
Short range order
Stacking faults
Interactive examples
Displacement waves
Short range order
Stacking faults
Goto
Contents
- alpha = 0: This describes a random distribution of vacancies.
- alpha < 0: Here we have a tendency for unlike pairs, i.e. vacancies pairs in that direction are less likely to occur compared to the random case.
- alpha > 0: In this case there is a tendency to cluster, i.e. vacancies pairs in the given direction are more likely to occur compared to a random distribution.
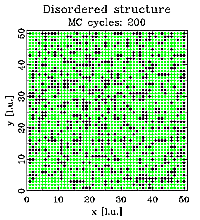
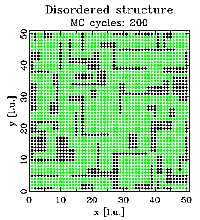
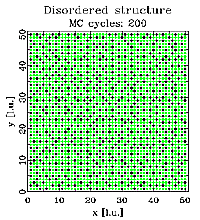
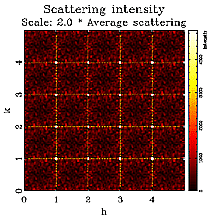
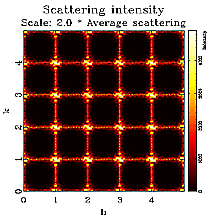
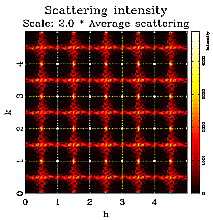
The figures below show three different vacancy ordering distributions. In all cases the size of the simulated crystal is 50x50 unit cells with one atom (shown as green dots) per unit cell. The crystal contains 30% vacancies shown in black. The left figure shows a random distribution. The middle figure corresponds to a positive nearest neighbor correlation. The tendency to have like neighbors along the x and y direction forms the chains of vacancies. Finally the right figure shows a structure with a negative nearest neighbor correlation. It can clearly be seen that the structure contains no vacancy nearest neighbors. Again, you might click on the figures for an enlarged view.
The structures shown above were created via Monte Carlo (MC) simulations using the program DISCUS. A detailed description of the simulation technique is beyond the scope of this tutorial, interested readers might refer to the DISCUS users guide for details. Next we look at the corresponding neutron diffraction patterns shown below. One quadrant of reciprocal space is shown, units are reciprocal lattice units (see basic examples). The left image show the pattern for the random vacancy distribution. The diffuse scattering is essentially uniform (the remaining 'noise' is due to the limited size of the simulation). The middle figure corresponds to the structure having a positive nearest neighbor correlation. We can observe diffuse streaks running through the Bragg positions at integer h and k. The structure with the vacancy ordering showing a negative correlation produces the diffraction pattern shown in the right figure. In this case we observer diffuse streaks intersecting half way between Bragg peak positions.
Here is a brief mathematical derivation of the diffuse scattering observed. One can derive the following expression for the diffuse intensity from chemical ordering alone:
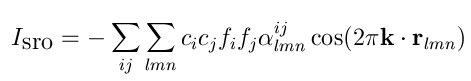
The first sum is over all chemical species, e.g. AA, AB and BB and the second sum is over all neighboring vectors r(lmn). The values alpha are the correlations, c(i) concentrations of atom type i and f(i) the scattering power of atom type i. Try simplifying the expression for vacancies (f=0) and derive the expression for a random distribution. In that case a uniform diffuse scattering is found. What can be seen from the expression, that every non-zero correlation contributes a cosine and the diffuse scattering is simply a sum of those cosines which we simulated way back in assignment two. Even without mathematics, some information can be taken from simple inspection of the scattering pattern. A positive correlation a100 for example creates diffuse streaks through the Bragg peaks parallel to h and k and a negative a100 will give the same streak between Bragg peaks. It should also be noted that the scattering intensity is symmetric around the Bragg positions. Note that in these examples we refer to a100 as the set of symmetrically equivalent 100 directions.
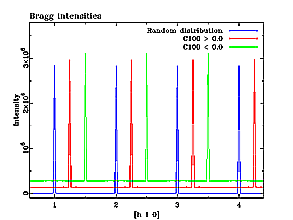
The figure above shows a cross section along h of all three scattering patterns. Since Bragg scattering only contains information about the long range average structure, the Bragg peaks are identical for all three cases, in other words routine structure refinement could not distinguish between the three structures shown at the top of this section. The only information one could extract is the overall concentration of vacancies in the crystal. In order to obtain information about SRO, one needs to analyze the diffuse scattering. This illustrates the importance to include diffuse scattering to obtain a complete structural picture of a given system. Before proceeding to the next section, check out the interactive simulation about SRO.